Greetings from the farm in Williard, MO, and the lake in Davidson, NC, as we took some time away to celebrate four birthdays over a single weekend (ages 11, 14, 23, and old enough). The farm is a terrific place to clear your mind and do different things, like clearing logs that washed up after spring flooding.
As a result of Mike Dano’s mention of the Sunday Brief in Light Reading this week (here), we have had a spike in readership and requests for the weekly newsletter addition. Many thanks to Mike for the terrific article and the mention (there’s a good Twitter feed on the article as well here).
This week, we return to looking at the US economy. When the stimulus checks run out and vaccinations level off, what’s the new normal? Will the telecommunications industry actually return to a new normal if infrastructure spending continues? Does it feel like 1991 (the beginning of a decade like no other), 2001 (post 9/11), 2011 (a slow but steady recovery), or a unique and completely different time? We will bring some data to the party, but the single word, in our opinion, to describe the next decade is “irreversible.” Overall, we think that’s a good thing for the most of the telecommunications industry.
Before diving into market results, a reminder that we will not publish an Easter edition of The Sunday Brief. We will, however, post several videos/ podcasts/ articles that did not make the Brief next Thursday evening.
The week that was

This week’s word to describe market activity is “Waiting” (cue Eric Clapton’s epic 1985 Live Aid performance of “She’s Waiting” here). The market is slowly forming hypotheses about life after COVID-19 that include a variety of growth types – revenues, EBITDA, cost of capital, wages, and inflation. It’s been a “one step forward, one step back” cycle, which is thankfully a lot less dramatic than last March (see our column from a year ago here) but at the same time seems more tepid than the flurry of economic activity would indicate.
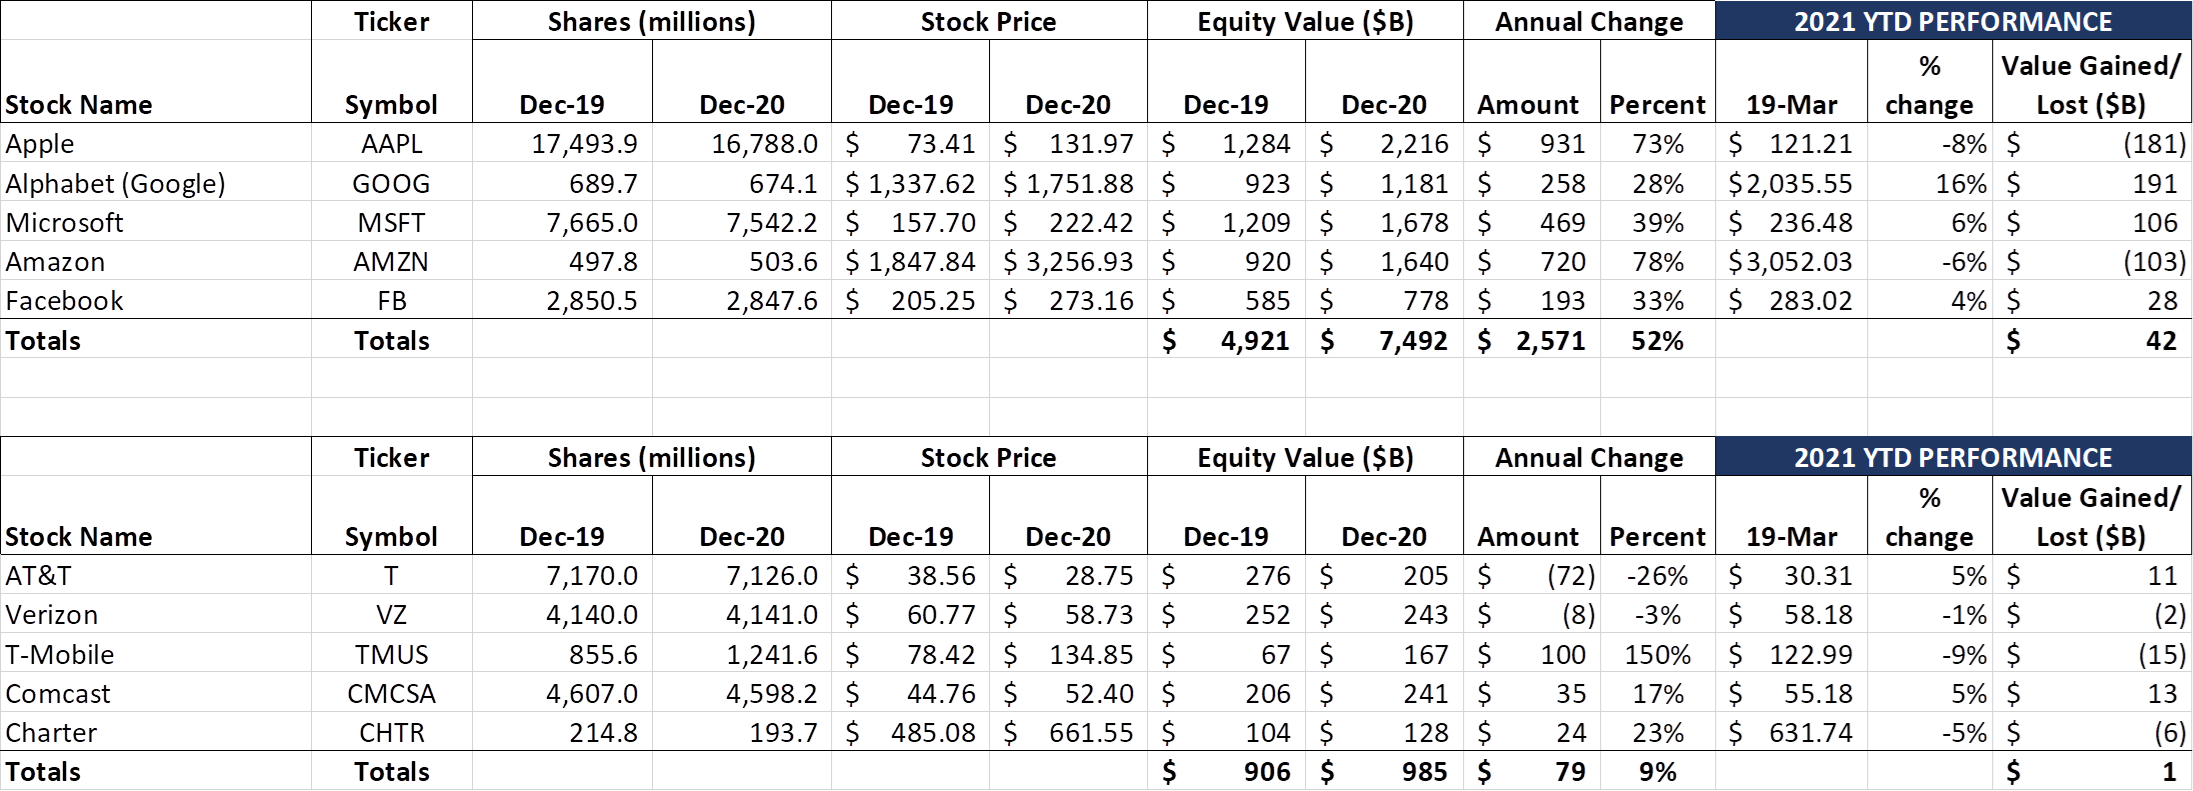
For the Fab Five, waiting is good. After losing $770 billion through the first eleven weeks, they went on to have total gains of nearly $2.6 trillion – more than a $3.3 trillion bounce in the last nine months of the year. Holding on to over $4 trillion of gains in 2019 and 2020 is an achievement. This week, the Fab Five gained $30 billion through a combination of Apple (+$20 billion) and Microsoft (+$46 billion) gains, offset by Facebook (-$20 billion), Amazon (-$11 billion), and Google (-$5 billion) losses. Overall, they have gained $42 billion on a beginning of year valuation of $7.5 trillion (less than 1%). No correction, but also no rocket – just waiting for strong, exchange-rate fueled earnings.
For the Telco Top Five, waiting means something different. This was to be the year that 5G changed everything. Now, capital budgets are being reprioritized to keep investment grade debt ratings, and smartphones are in varying supplies. For the week, the Telco Top Five gained $9 billion, helped by AT&T (+$4 billion) and Verizon (+$8 billion), offset by T-Mobile (-$2 billion), Comcast (-$1 billion), and Charter (flat). The impact of infrastructure spending on the broadband competitive landscape remains a key focus point – more clarity on this front may drive greater (upward or downward) momentum.
There are three events that deserve consideration prior to diving into an economic analysis. First, Congress put the CEOs from Twitter, Google, and Facebook on center stage yet again this week to discuss a variety of topics, including misinformation related to the January 6, 2021, Capitol riots, changes in Google Chrome’s advertising practices, and the role of social media with respect to children (all 5.5 hours of testimony here courtesy of YouTube and Reuters; testimony summaries from the New York Times here and Washington Post here). Using the phrases of a former Darden professor, Ed Freeman, the “yes/no” format resulted in a lot of “heat” rather than “light.” The bottom line is that Congress missed yet another opportunity to make progress on significant issues.
Our recommendation is that all future tech CEO hearings be held in private, free of “yes/no” format, and focus on 1-2 core issues like child privacy, tech censorship transparency, Section 230 revisions, or opt-in/ opt-out designations. Separately, we cannot let this event pass without recommending Steven Levy’s cheeky article in WIRED on Friday titled “Here’s What the Tech CEOs Wish They Could Say to Congress.” A good read for the Easter Holiday if not prior.
Second, Geolinks announced on Friday that they were buying 208 LMDS licenses (29 GHz/ 31 GHz) from Verizon (announcement here). From our previous analysis of Verizon’s XO acquisition (see slide below), this appears to mostly be the Nextlink (XO) spectrum (Map shows XO footprint prior to Verizon’s acquisition):

While many of you thought that this somehow signals that Verizon is pulling out of MMDS deployment, we see it differently. As the Geolinks’ news release indicates, the spectrum “is not suitable for flexible use.” Geolinks had a need for additional LMDS cities, and Verizon had little need for backhaul-focused spectrum in markets where they were building out dense fiber networks. More information in this RCR Wireless article.
Lastly, Microsoft is on the acquisition prowl – again. Fresh off of the purchase of video game developer/ publisher ZeniMax (Bethesda Softworks) for $7.5 billion, the Bellevue giant is reportedly in exclusive talks to acquire messaging company Discord for $10 billion (see Wall Street Journal article here) or roughly $71 per monthly active user (140 million according to the Journal). While many see Discord as a gaming messaging platform, the underlying technology can be integrated into Microsoft Teams or even LinkedIn. The voice messaging element of this also has some of the structure of the popular Clubhouse invite-only social media service. Microsoft’s ability to make this transaction successful rests on their plans to increase adoption of services to Discord’s existing users.
Happy days are here again?
Many of you have posed the question: How will the next 12-24 months unfold, and how will this impact the telecom industry? We started to answer this question in our Brief entitled “The Essential Economy in 2021: Uneven, Unstable, Unemployed, and Underwater” but thought we would expand on several points. Here’s what we know so far:
1. Residential Broadband Shines. High Speed Internet grew substantially in 2020. Leichtman Research Group released their 2020 growth summary for broadband subscribers earlier this month (press release here). The bottom line is that there were nearly 2x more broadband customers added in 2020 than in 2019 – last year’s industry growth represented the best year since 2008. Gains accrued almost entirely to the benefit of cable companies, specifically Charter and Comcast, and cable now holds more than a 2:1 (69/31) market share compared to their telco competitors.
Profitability is growing thanks to broadband subscriber increases, and it’s unlikely that those who have upgraded to higher broadband tiers during the pandemic will suddenly downgrade once in-school learning and in-office time increases. This should keep profitability per subscriber high.
While telcos are beginning to deploy more fiber (AT&T targeting 3 million new fiber-equipped homes in 2021; Consolidated building out more than 300,000 million homes in 2021; Windstream also deploying 100,000 additional businesses with fiber in 2021), they face a new hurdle – broadband aggregation services such as Comcast Flex. We think that continued development of aggregation platforms (including the trend that Comcast’s Peacock service morphs into a multi-channel platform – more on that might happen here) dampens the attractiveness of new fiber entrants. Couple content with a new generation of DOCSIS, and market share gains (above existing telco DSL customer conversion) will become more difficult.
Bottom line: Cable broadband grows slowly in 2021, but profitability remains high and capital intensity continues to diminish – 2020’s trend is irreversible. Cash flow peaks and the relatively low cost to upgrade to DOCSIS 4.0 make companies like Mediacom and Altice (Suddenlink) increasingly attractive to potential acquirers. Cable improves their position in 2021 – 2022 depends on a variety of competitive factors and potential government infrastructure spending.
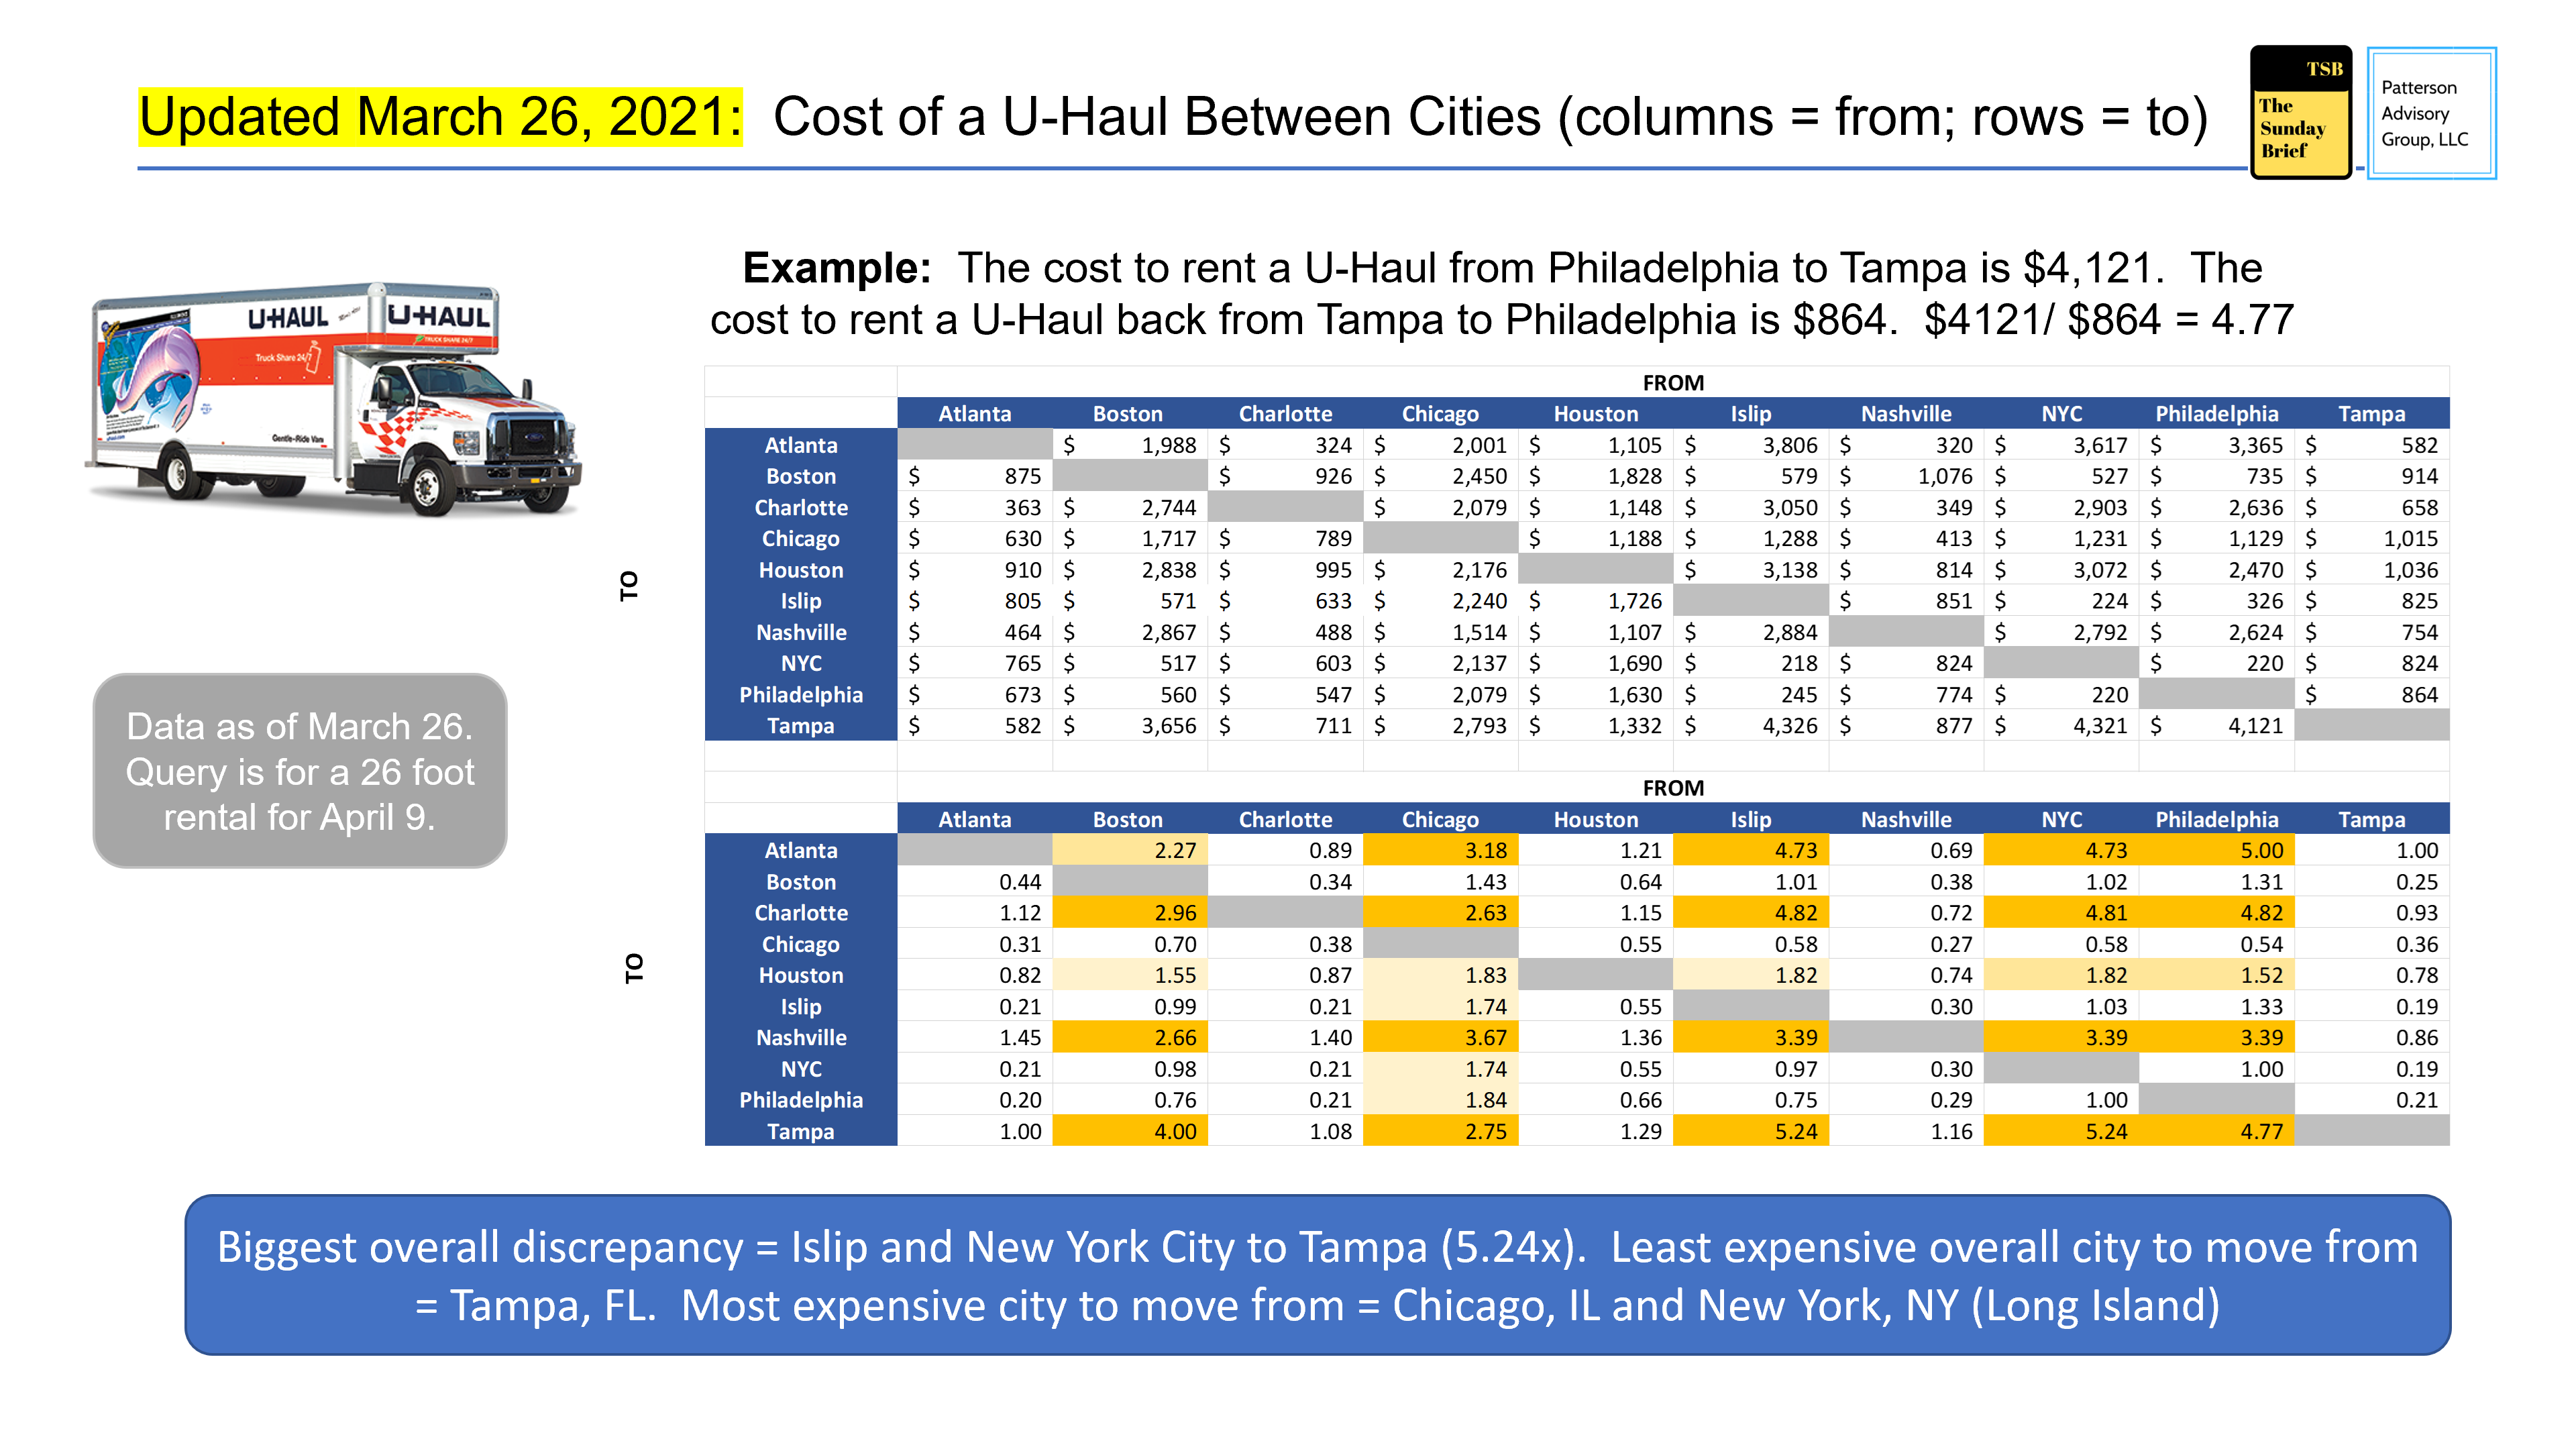
2. Movement to South and West Continues. While there are still “shoots of green” articles concerning the New York City real estate market (see here and here), our view, backed up by the latest U-Haul data, indicates that the population outflow from cities such as New York, Boston, and Philadelphia continues. Back in August, we took our second look at the data (Brief here) and concluded that the “spikes” were beginning to spread. The latest data confirms that thesis:

3. Here are the major conclusions from last week’s analysis:
a. The supply/demand imbalance between northern and southern markets has largely grown. In August, the ratio between Boston and Tampa was 3.8 – now it’s 4.0. Even greater increases were seen from Philadelphia and Tampa (3.60 to 4.77), and New York City/Islip and Tampa (4.0 to 4.24). Atlanta also saw increases across the board compared to August from Boston, Chicago, New York/ Islip, and Philadelphia. Charlotte saw increases versus New York/ Islip and Philadelphia, but Boston and Chicago changes versus August were relatively muted.
b. The New York city flight to neighboring markets (e.g., to Philadelphia) has leveled off. Our assumption, validated by data, was that folks who left New York in March, April and May last year likely settled to a less densely populated areas like Lancaster or Harrisburg or Syracuse versus another metro like Philadelphia. The new batch of data leads us to believe that city-to-city demand is largely leveling off (ratios more closely trending to 1.0).
c. Tampa is the destination city of choice (e.g., the metro area with the greatest supply/ demand imbalance). Charlotte and Nashville are not far behind, and Atlanta also close to the pack. Conversely, Chicago (and to a lesser extent New York City) has the greatest imbalance.
U-Haul’s own analysis from earlier in the year supports these conclusions. Tennessee, which ranked 12th in 2019, jumped to 1st place in 2021. Arizona and Colorado, favorite “move to” destinations from current Californians, moved from 20th to 5th and from 42nd to 6th respectively. Seven of the bottom ten states from 2019 remained at the bottom in 2020 (breaking out: Colorado surged to 6th, Michigan from 48th to 40th (barely out), and Wisconsin from 41st to 13th, largely at Chicago’s expense).
Bottom line: The Southern move is irreversible, thanks to COVID-related teleworking and taxation-related considerations. Even if the current Congress removes State and Local Tax (SALT) deductibility caps, too many have already committed to a new beginning.
State recoveries will be vastly different due to different COVID responses
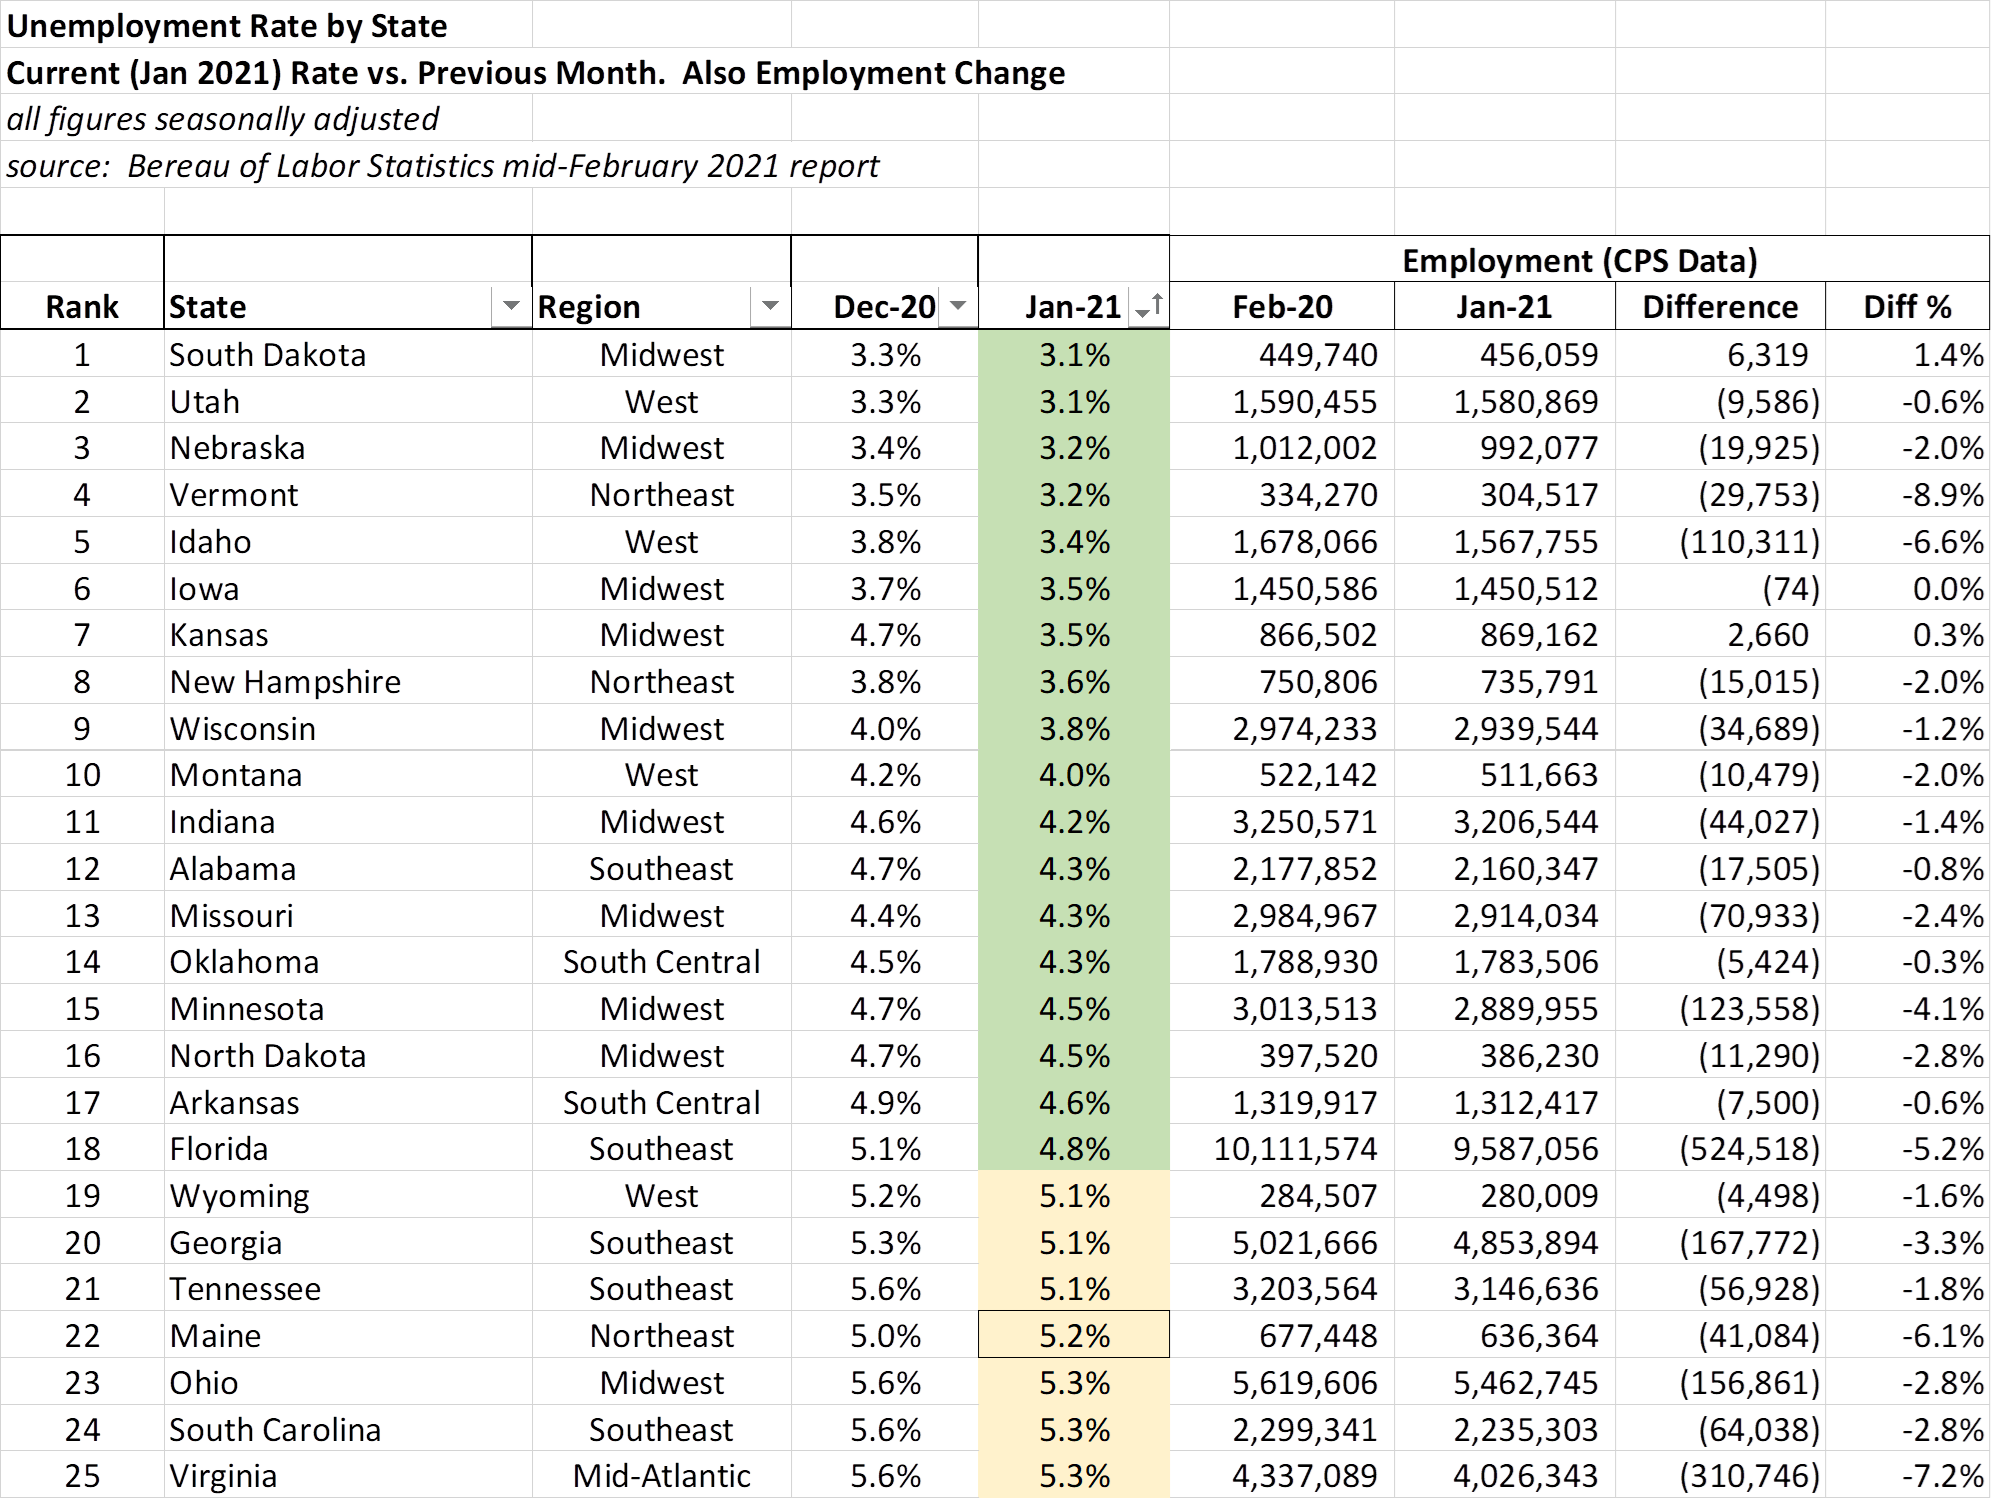
As many of our regular online readers remember, we posted unemployment data to the website that generated a lot of discussion (M3 vs M6 rates, etc.). Since then, the Bureau of Labor Statistics has posted January 2021 numbers (note: January triggered a wave of reclosures and restrictions in many states). We anticipate that February numbers (to be released in mid-April) should reflect further improvements. Here is the chart reflecting the monthly change in the unemployment (M3) rate but also the employment level compared to February 2020 (from the Household survey, seasonally adjusted):

There are 18 states that currently have unemployment rates less than 5%. These states employ in total 37.7 million people (about 10 million more than California and New York combined). The cumulative difference between the number of people employed in January compared to February 2020 (which was close to if not the peak employment month for many of these states) is 1.03 million people. Over half of that difference is the leisure and entertainment-rich state of Florida.
The top 25 states employed over 58 million people in February 2020. Each of these states has an unemployment rate less than 5.4% (considered by many economists as the high end of “full employment”). The cumulative difference between current and February 2020 unemployment is 1.8 million people. Ten of the 25 states are in the Midwest, five are in the Southeast, and four are in the West. Only three are in the Northeast.
At the bottom of this list are the states of New York and California. Here’s the data for those two states (the highest unemployment state is the tourist-heavy island of Hawaii):

New York and California employed 27.8 million people in February 2020 and now employ 25.5 million people, resulting in an employment gap of 2.3 million people.
Bottom line: California and New York employ ~ 30 million fewer people but have a larger post-COVID employment gap than the top 25 states for employment combined. Unequal needs are driven by different demographics and COVID-19 responses by each state.
For telecom companies, happy days are ahead for cable companies with large concentrations in the South Central, Southeast, and Midwest (Charter, Comcast, Cox and Mediacom, likely in that order). Those companies that are under-indexed in broadband with less exposure to the regions identified above are going to struggle (CenturyLink, and to a lesser extent, Verizon and Frontier). We will continue to track progress on these and other Essential Economy metrics. The description of “Uneven, Unstable, Unemployed and Underwater” accurately reflects the current economic situation.
Next week, we take a break for the Easter holiday but will post some material for your viewing and reading pleasure (likely Thursday evening). Until then, if you have friends who would like to be on the email distribution, please have them send an email to sundaybrief@gmail.com and we will include them on the list (or they can sign up directly through the new website). Thanks again for the referrals.
Have a great week and Go Davidson Wildcats!
The post The Sunday Brief: Happy days are here again? appeared first on RCR Wireless News.
