
Does the federal government finally have one broadband map to rule them all?
Not quite, but it is getting closer. The National Telecommunications and Information Administration recently released a new, public broadband mapping tool that for the first time, overlays a number of different public and private data sets meant to provide a better sense of “broadband need” in a given area, and it is more granular than the census-block-level Form 477 data that deems a block to be “served” by broadband if at least one location within the block has broadband access. And NTIA has an even more detailed version, the National Broadband Access Map, drawing from nearly 400 data sets and services, that participating state governments and federal agencies can access in order to help shape policy and program decisions.
Here are four things to know about NTIA’s newly released Indicators of Broadband Need (IBN) map (you can access it here), as well as the overarching NBAM.
–Each mapping tool draws on both public and private data. However, there are major differences between the data sets, and the IBN is far more limited and simple. Geographically, the IBN integrates county, census tract and census block data and shows where Tribal lands are located as well as the locations of institutions classified as “minority serving,” such as Historically Black Colleges and Universities (HBCUs), and census-tract level data on whether a particular tract is considered “high poverty”, where 20% of households or more are below the federal poverty level. The IBN can then layer information from another half a dozen data sources: Form 477 data on whether a block is reported by a fixed service provider to be “served” or “unserved,” speed test data from Ookla and M-Lab, county-level data on whether Microsoft devices connect for automatic software updates at speeds below 25/3 Mbps (the FCC’s standard for broadband), plus data from the American Community Survey on where 25% of households or greater report that they either do not have internet access, or they report not having a computer, tablet or smartphone.
Using those layers enables better visibility into correlations between poverty and broadband access, or historically underserved communities such as Tribal lands. NTIA has said that this is the first public map that allows users to compare and contrast those data sources. U.S. Secretary of Commerce Gina Raimondo said that it “paints a sobering view of the challenges facing far too many Americans as they try to connect to high-speed broadband and participate in our modern economy.”
Tim Moyer, director of data and mapping at NTIA, walked through the use of the IBN map in a webinar yesterday from the Fiber Broadband Association, showing how starting with basic layers of information, such as the Form 477 data, can be supplemented with the other data layers reinforce which places need more attention to their broadband needs.
“There is no silver bullet data set. These are indicators — they inform the conversation, they are not determinant,” Moyer emphasized. “But it certainly tells us a little bit more than the 477 by itself.” The public map, he went on, is meant to give a better level of understanding to the public about broadband needs. The NBAM, by contrast, is a more complex and precise GIS mapping tools which are not public, and which have functionalities such as the ability to upload GIS files to compare proposed broadband projects. The NBAM is available to participating state and federal partners and it draws from 380 different data sources and services, including Ookla speed test data that drills down to a 100-square-meter basis. Using that data, Moyer said, agencies such as the U.S. Department of Agriculture are already making use of the NBAM to find pockets of unserved areas within census blocks that appear to be served if you’re only looking at 477 data. Based on the NBAM data, he said, USDA “actually [puts]boots on the ground and they go investigate,” he added. “The crowd-sourced data is not determinant and results in decision-making, but it informs the discussion and tells us where we need to pull back the onion a little bit more and investigate to see, huh, these areas are not eligible for funding right now. Could they be? Should they be?”
–The broadband “need” in an area may not be pure infrastructure. The darker an area is on the Indicators of Broadband Need map, the more factors are saying that people there don’t have any, or sufficient, broadband service. But meeting that need might not just involve infrastructure, Moyer pointed out. He said that NTIA is already fielding inquiries from service providers who have looked at the new map and have seen areas that they consider served which nonetheless are dark on the map. NTIA’s first recommendation to service providers, he said, is to turn all the “indicators of need” layers off on the map, so that they can see the self-reported Form 477 data as a starting point. The map, after all, includes data that reflects usage and equipment availability as part of broadband need. The ACS data reflects, for example, how consumers answered the survey question of whether or not they have internet access — but not whether it was due to no available provider, affordability or personal preference. “It doesn’t suggest that it’s necessarily infrastructure, it may be a digital inclusion issue,” he said. “We know that this is both infrastructure and use, and some communities don’t use the internet the way that others do. It’s not pointing a finger to say there’s no infrastructure, it’s pointing a finger to say, we’ve got to look into this area more, because there certainly are question marks.”
-The IBN map is not meant to help service providers figure out eligible areas for subsidy programs. Moyer acknowledged that it is problematic that it’s so difficult for service providers to figure out eligible and non-eligible areas for the multiple federal and state broadband subsidy programs that are available — but the IBN “is not designed for that level of decision-making. It is a public tool to help the public better understand the digital divide,” he said. And the full NBAM isn’t publicly available — it’s meant to help government administrators. NTIA will use the NBAM to help inform its own grant programs, Moyer added, such as for review of applications and also to look at planned funded service areas and working with, for example, USDA, on both targeting and avoiding overlaps in funding. Asked about whether the IBN map can indicate whether an area is “likely eligible”, Moyer said, “it means it’s likely eligible for further investigation to see if it actually truly is eligible.” A large census block, for example, may have both a served populous area and rural areas that are not served — the IBN map is meant to highlight which areas need to be checked out.
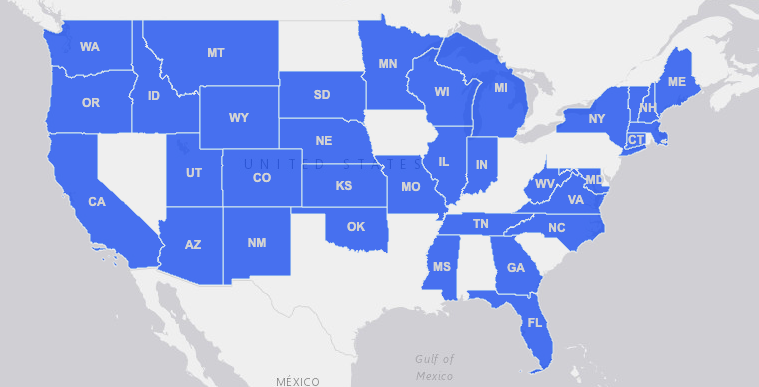
–Not everyone has access to the NBAM. Even among government entities, access to NBAM will vary from state to state. States and federal agencies have to opt in to participation in order to get access to the GIS platform. NTIA has slowly been adding participating states to its list of NBAM partners since it started with eight states in 2018, but it’s not 100% yet. In mid-May, the agency announced that it is up to 36 states participating, with Arizona, Idaho, Kansas, Maryland, Mississippi, and South Dakota the most recent additions. Four federal agencies also participate in the NBAM: USDA, the Bureau of Indian Affairs (BIA), the Economic Development Administration (EDA) and the Appalachian Regional Commission (ARC).
“Any effort to close the digital divide starts with solid data, and NTIA continues to help policymakers make more informed decisions on expanding broadband access,” said Acting NTIA Administrator Evelyn Remaley in a statement on the IBN. “Now, the public can benefit from our platform to see which areas of the country still don’t have broadband at speeds needed to participate in the modern economy.”
The post Four things to know about NTIA’s new broadband map appeared first on RCR Wireless News.