
Greetings from Charlotte, where we have turned the page on a value-destroying February with hopes that March brings some needed relief. Here’s a snapshot of the carnage from the week that was (versus 2019 market gains):
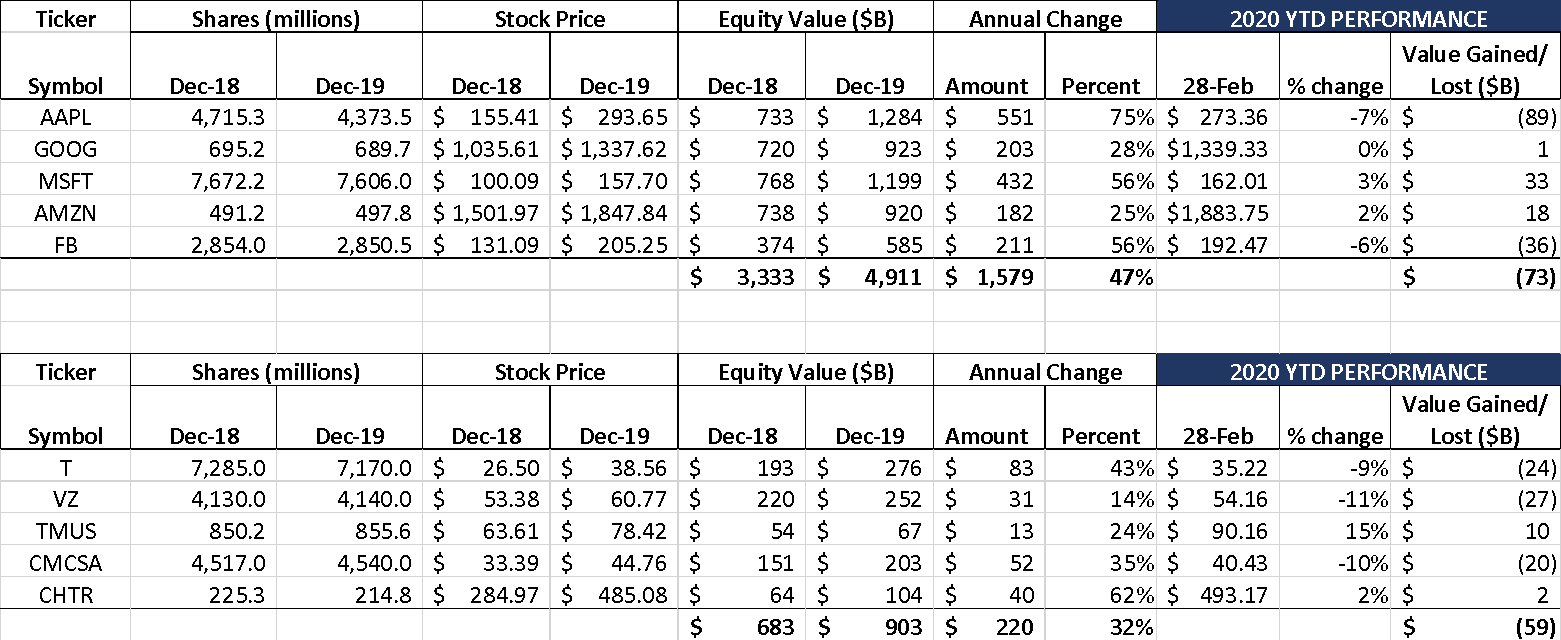
As many in the financial community have already articulated, last week’s losses need to be put into context. For example, Apple added $551 billion in equity market value in 2019 (albeit from a low end to 2018) and has given $89 billion back (16% of 2019’s gains) year to date. Facebook has given back $36 billion vs $211 billion created in 2019 (17%). And Google, Microsoft, and Amazon are still up for the year (barely, but cumulatively holding on to over $800 billion in equity market increases since the beginning of 2019).
In fact, the only company described above that is remotely approaching giving back the market value gained in 2019 is Verizon ($31 billion increase in 2019 and $27 billion market value lost in 2020 YTD), and this excludes a ~4% annual dividend yield. 73% of the Top 5 Telecommunications 2019 gains and 95% of the Fab Five 2019 gains are still intact. Traders may not be happy, but those who have remained long in the market are still grinning.
Many of you have asked “shouldn’t fibernation (hibernating with a high-speed connection) be good for Comcast and others?” The answer is not as easy as it first appears. More home-based workers will benefit home electronics sales and drive more social media, Zoom videoconferencing, and home deliveries, but will this come at the expense of 5G deployments (a multiple-driving event)? What is the countereffect of increased fibernation on the housing market? What if non-political advertising (especially local auto dealers) pulls back? Or, if the virus effects are prolonged and we dip into recession, will this accelerate cable downgrades (said another way, if this worsens, could HBO Max launch at a worse time)? There are a wide array of possible outcomes, and this uncertainty is stoking market volatility.
On the positive side, the 10-Year Treasury Bill slipped to 1.16% which could trigger a wave of corporate re-financings (not that T-Mobile CFO Braxton Carter would smile during a crisis, but there is a silver lining for current T-Mobile debt). Here’s the current T-Mobile debt schedule (link here):

$4 billion of the senior notes described above are tied to LIBOR. Assuming the 1-yr LIBOR rate is used as the benchmark, the decrease in annual interest expense alone on the $4 billion (Bankrate data here) is ~$50 million. And then there’s $7 billion or so in senior notes held by the public that are yielding 6% or more (note: I have not checked the call provisions of each note). Assuming the notes are callable, T-Mobile could likely borrow at 4% or less, and every 1% represents $70 million in interest savings. That’s close to $200 million in non-EBITDA impacting annualized savings (+5.8% impact to 2019 net income) before consolidating the Sprint and T-Mobile revolvers and other possible Sprint debt actions. Low interest rates could not come at a better time for T-Mobile (and likely others in the telecom universe).
This week’s Sunday Brief is more than stock market commentary. We will deal with the longer-term crisis of a broken incumbent telco (formerly known as Incumbent Local Exchange Company or ILEC) world. Specifically, we will talk about the fate of AT&T’s non-metro franchises. We will also have a few TSB follow-ups.
Before that, one correction to last week’s column. The discussion surrounding Softbank’s agreement to change the terms of their deal with T-Mobile (#5 in the TSB Follow-ups section) should read as follows (changes italicized):
In summary (SEC document is here), Softbank will give T-Mobile USA 48.8 million shares once the transaction is complete. Softbank can regain these shares, however, if TMUS stock averages more than $150/ share over any 45-day period between 2022 and 2025. At T-Mobile’s current share price ($98.57), that implies an ~9% average annual share price increase from today to reach the $150 trigger price (and, as we noted in a previous TSB, T-Mobile had a 24% price appreciation in 2019). It’s also important to note that to reclaim the shares, the $150 price only needs to be achieved for 45 days. One cable merger rumor could easily trigger that.
We had previously stated that the price needed to only touch $150 for a day. The point still holds – we believe that Masa will laugh last with respect to this deal (although a 66% appreciation in T-Mobile’s stock price in five years would probably be welcomed by all shareholders).
The incumbent local exchange carrier – Incumbent in name only
There was a time when local telephone companies were viewed with utility-like reverence. They controlled connectivity into the home and office. They provided consistent, reliable universal service. They made money through economic downturns and returned profits through steadily growing dividends. And they were the local brand: Rochester Telephone, Concord Telephone, Southern New England Telephone, South Central Bell, etc.
Based on our research, the local phone aura peaked 2006/2007 with the completion of SBC/AT&T’s purchase of BellSouth in a stock-for-stock transaction valued at $67 billion (this excludes $22 billion in debt assumption). At that time, AT&T was the most valuable telecommunications company in the world with a $170 billion market capitalization. Here’s are the pro forma statistics from their 2006 annual report:
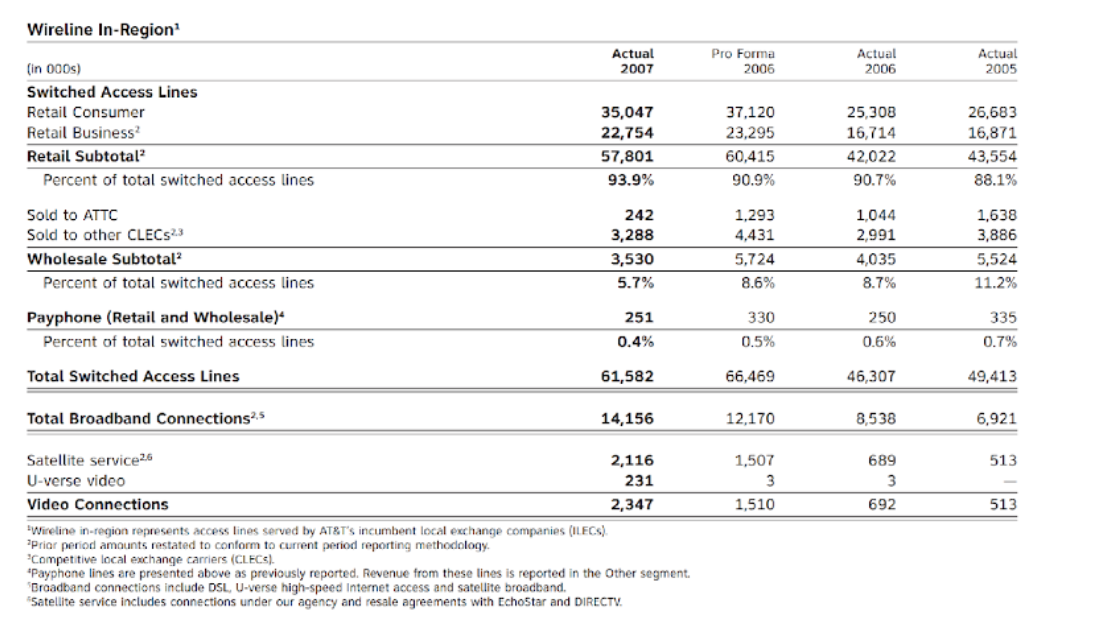
At the end of 2006, AT&T passed ~ 45 million homes. Assuming that they had 1.05 access lines per home (2nd line was waning by that time), AT&T likely had a retail revenue relationship with 35-36 million residences (~80%). They probably had a wholesale relationship (consumer local loop) with another million or so homes for a total penetration of 81-82%.
Here’s the trend for the five years from 2007-2011 (in-region network access lines in service):
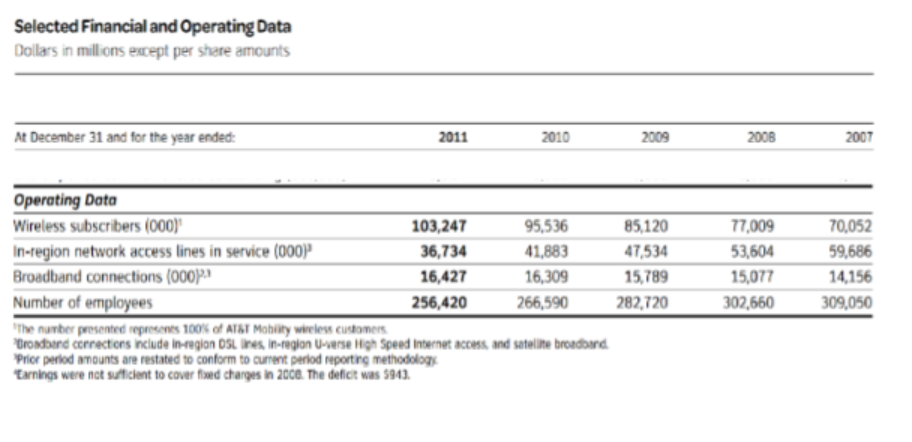
From 2006 through 2017, AT&T has sold one local exchange – AT&T Connecticut (~1.4 million homes) – to Frontier for $2 billion in cash. This leaves an addressable market of around 43-44 million homes today (about 35-37% of the 119-121 million total homes passed in the US). Against that backdrop, AT&T’s network access line penetration is ~ 27% and their overall broadband penetration is ~ 36%. Broadband subscribers have stayed stubbornly flat.
What’s amazing about this 10-11 year stretch is that there are now 48 million access lines worth of investment (~60 million switched access lines in service as of the end of 2007 – see 2nd table – less 12 million remaining as of the end of 2017) that are not producing revenues. A small fraction of them moved to broadband with no phone line, but most of them went to cable or wireless. That’s an 80% reduction in 10 years. Bottom line: It’s hard to make the argument that AT&T is actually an incumbent local exchange carrier in many/ most of their markets today – the cable company has likely taken that title (although they may not want those responsibilities). In fact, it’s highly plausible that AT&T does not have a relationship with more than 40% of their customers in most of their local territories.
On a recent Wells Fargo call, Jeff McElfresh divided the 43-44 million homes as follows:
- 14.5 million of these (33%) are fiber-fed
- ~20 million (45%) are VDSL enabled
- The remaining 9 million or so (22%) are neither fiber-fed or VDSL enabled
On that call, Jeff seemed to leave all options open for the remaining lines. However, it’s unlikely that a buyer would only purchase the “copper donut” but would want both the fiber and copper in a metro area like Tupelo, MS:

Tupelo is a combination of ~ 70-75% DSL fed, 8-11% fiber-fed and the remainder with very limited speeds. According to our research, the best concentration of AT&T fiber is downtown (not in the suburbs where AT&T faces a fiber-based challenger in C Spire). Any sale of Tupelo would likely have to have both fiber and DSL assets. While we have not researched every AT&T exchange, we don’t think outside of large metropolitan areas (like Atlanta, Miami, Dallas/ Ft. Worth, Los Angeles, etc.) that AT&T will be able to pull off a partial sale.
Bottom line: Traditional local exchange providers (including AT&T) are in a real pickle. They do not have the balance sheet to expand fiber (their competition, in many instances, has the risk profile and cash to build), and are not guaranteed to win business where they do. Asset sales will need to incorporate existing fiber deployments. And Verizon, once a friend, has turned foe in many downtown areas with their aggressive fiber builds. Meanwhile cable continues to take disproportionate share of broadband subscribers, especially in non-fiber areas. As we have said in the past “Something’s gotta give” and we think it means a) AT&T will sell off 10-15 million households worth of local exchanges in 2020/2021 and b) Windstream and others will follow AT&T’s lead with the sale of AT&T adjacent exchanges. The result will be a healthier local exchange industry, but likely one that will never regain their 2005-2007 heyday.
TSB Follow-Ups
- C-Band license auction is a “go.” In a 3-2 vote Friday, the FCC approved up to $14.7 billion to compensate existing C-Band license users for relocating to the upper end of the frequency (the auction would only incorporate the lower 280 MHz of the nearly 500 MHz swath). The opposition to this plan is bipartisan, as Senator Kennedy (R-Louisiana) issued a very terse press release opposing the move. It ended with the following assessment:

“It’s telling that, even after the FCC decided—in a divided vote—to give away $15 billion to foreign operations, those companies still aren’t happy. I suppose they’re angry their plan to scarf up all proceeds from the potential $70 billion auction didn’t work out. People say appetites grow by indulgence, and it’s true: These foreign satellite firms want all four feet and their snout in the taxpayer trough. The FCC shouldn’t be helping them.”
While there is consensus that this auction will proceed on December 8, we anticipate that the actual auction will not proceed until 2Q 2021 with initial use of the spectrum starting in mid-2022 (the Intelsat saga alone might delay it even further – more here). In the meantime, many carriers will implement CBRS and learn to live within a shared capacity framework.
2. The Mobile World Congress smartphone launch that wasn’t (LG V60 ThinQ 5G). On Thursday, LG announced the launch of their V60 ThinQ 5G smartphone. It’s very competitive on specs, and features a dual screen (see Droid Life’s hands on review here). This device will launch soon (no specific release date yet) on Verizon (including 5G mmWave), AT&T, T-Mobile, and US Cellular. As we discussed in last week’s column, LG has excellent smartphone product (at ACN, we found that LG users had more loyalty to a specific network and therefore less churn than their Samsung or Apple counterparts) that is not properly matched with the marketing/ promotion budget needed to grow market share. This contrasts with their low-end Android devices (e.g., the Tribute Empire we discussed last week) which competes aggressively with Samsung and Motorola in the sub-$300 smartphone category.

3. Is OpenSignal’s report a harbinger of the New T-Mobile network? On February 20, Ian Fogg and Francesco Rizzato posted some very interesting insights on 5G on the OpenSignal blog (here). Their last key point is as follows:
“U.S. carriers’ 5G services are held back by 5G spectrum availability. Some services are ultra fast but they offer limited reach. While others are much slower due to limited spectrum but have much better reach. U.S. carriers need the release of large chunks of mid-band spectrum to offer the best of both worlds and for 5G in the U.S. to hit its potential.”
They then include the following chart that provides a weighted average bandwidth for each network provider in their publicly stated deployed markets:
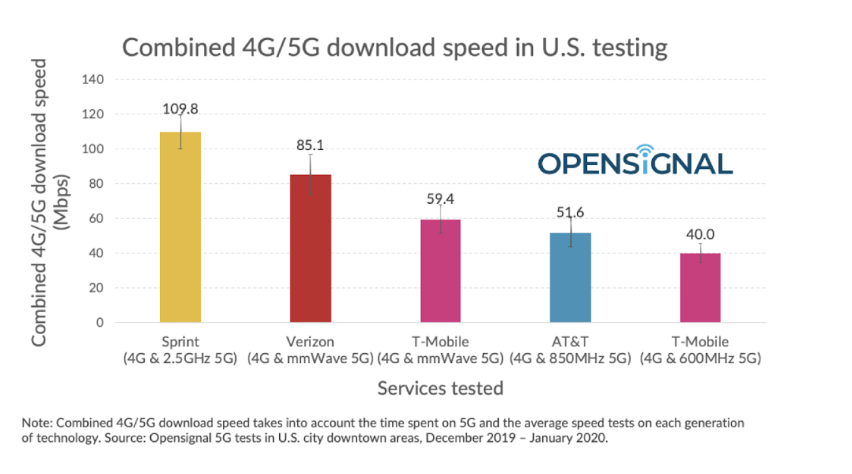
Sprint only has nine deployed markets, but customers with 5G devices accessed the network 47.4% of the time, and while they were on 5G, they received download speeds of 183 Mbps (re: UHD video requires a constant stream of ~25 Mbps per Netflix). While Sprint’s overall speed is impressive, what’s more intriguing is that the 4G LTE implied speed in these eight markets is around 44 Mbps. That includes New York City, Washington D.C., Chicago, Dallas/ Ft. Worth, Houston, Phoenix, Atlanta and Los Angeles. Combine Sprint’s 2.5 GHz with T-Mobile’s 600 MHz (the first two layers of Neville Ray’s “spectrum cake”), and you could be looking at 100 Mbps or higher average smartphone/ Hotspot speeds across 150 million or more POPs very soon. That will give the New T-Mobile a head start on Verizon and AT&T.
We have many more follow ups but will need to cover in future issues (including Nokia strategic options, the 3GPP upcoming meetings, unconfirmed Metro by T-Mobile layoffs, and FCC LBS fines) – you can click on the links for more info. Next week, however, we are going put on our policy waders and take a look at broadband policy in a Bernie Sanders administration (for a preview, click here). Until then, if you have friends who would like to be on the email distribution, please have them send an email to [email protected] and we will include them on the list.
Have a great week – and Go Davidson Wildcat Baseball (and Wildcat Men’s Basketball)!
The post The Sunday Brief: Incumbent in name only appeared first on RCR Wireless News.